Cernity Vantage
Cernity Vantage is the native, queue-centric analyst workspace that sits over your SIEM and a built-in health/metrics dashboard. Findings export to your existing SIEM (keep-your-SIEM); Vantage is where an analyst turns a lead into a defensible investigation and a disposition that tunes the pipeline. It is source-available and self-hosted.
- Source: github.com/cernity/cernity-vantage
- License: PolyForm Perimeter 1.0.1 — use, modify, and self-host for any purpose except offering a product that competes with Cernity (same license as the NDR core).
- Runtime: a small FastAPI service + static SPA. Config-driven: every endpoint, host, and token is supplied through the environment, server-side only — the browser never receives URLs or secrets.
For the how — the investigation method Vantage is built around — see the analyst investigation workflow.
Get it running
Vantage brings its own UI and dashboard; you point it at your Elasticsearch/OpenSearch (findings) and, optionally, your Cernity control-plane read APIs and a metrics backend.
git clone https://github.com/cernity/cernity-vantage
cd cernity-vantage
cp .env.example .env      # edit .env with your SIEM / bus / API endpoints + tokens
docker compose up -d      # builds and starts Vantage
# open http://localhost:8899
Or run the published image directly:
docker run -d --env-file .env -p 8899:8899 -v vantage-data:/data cernity/cernity-vantage:latest
.env is gitignored — real hosts and tokens never get committed. The repository ships a complete
.env.example documenting every setting.
What’s in Vantage
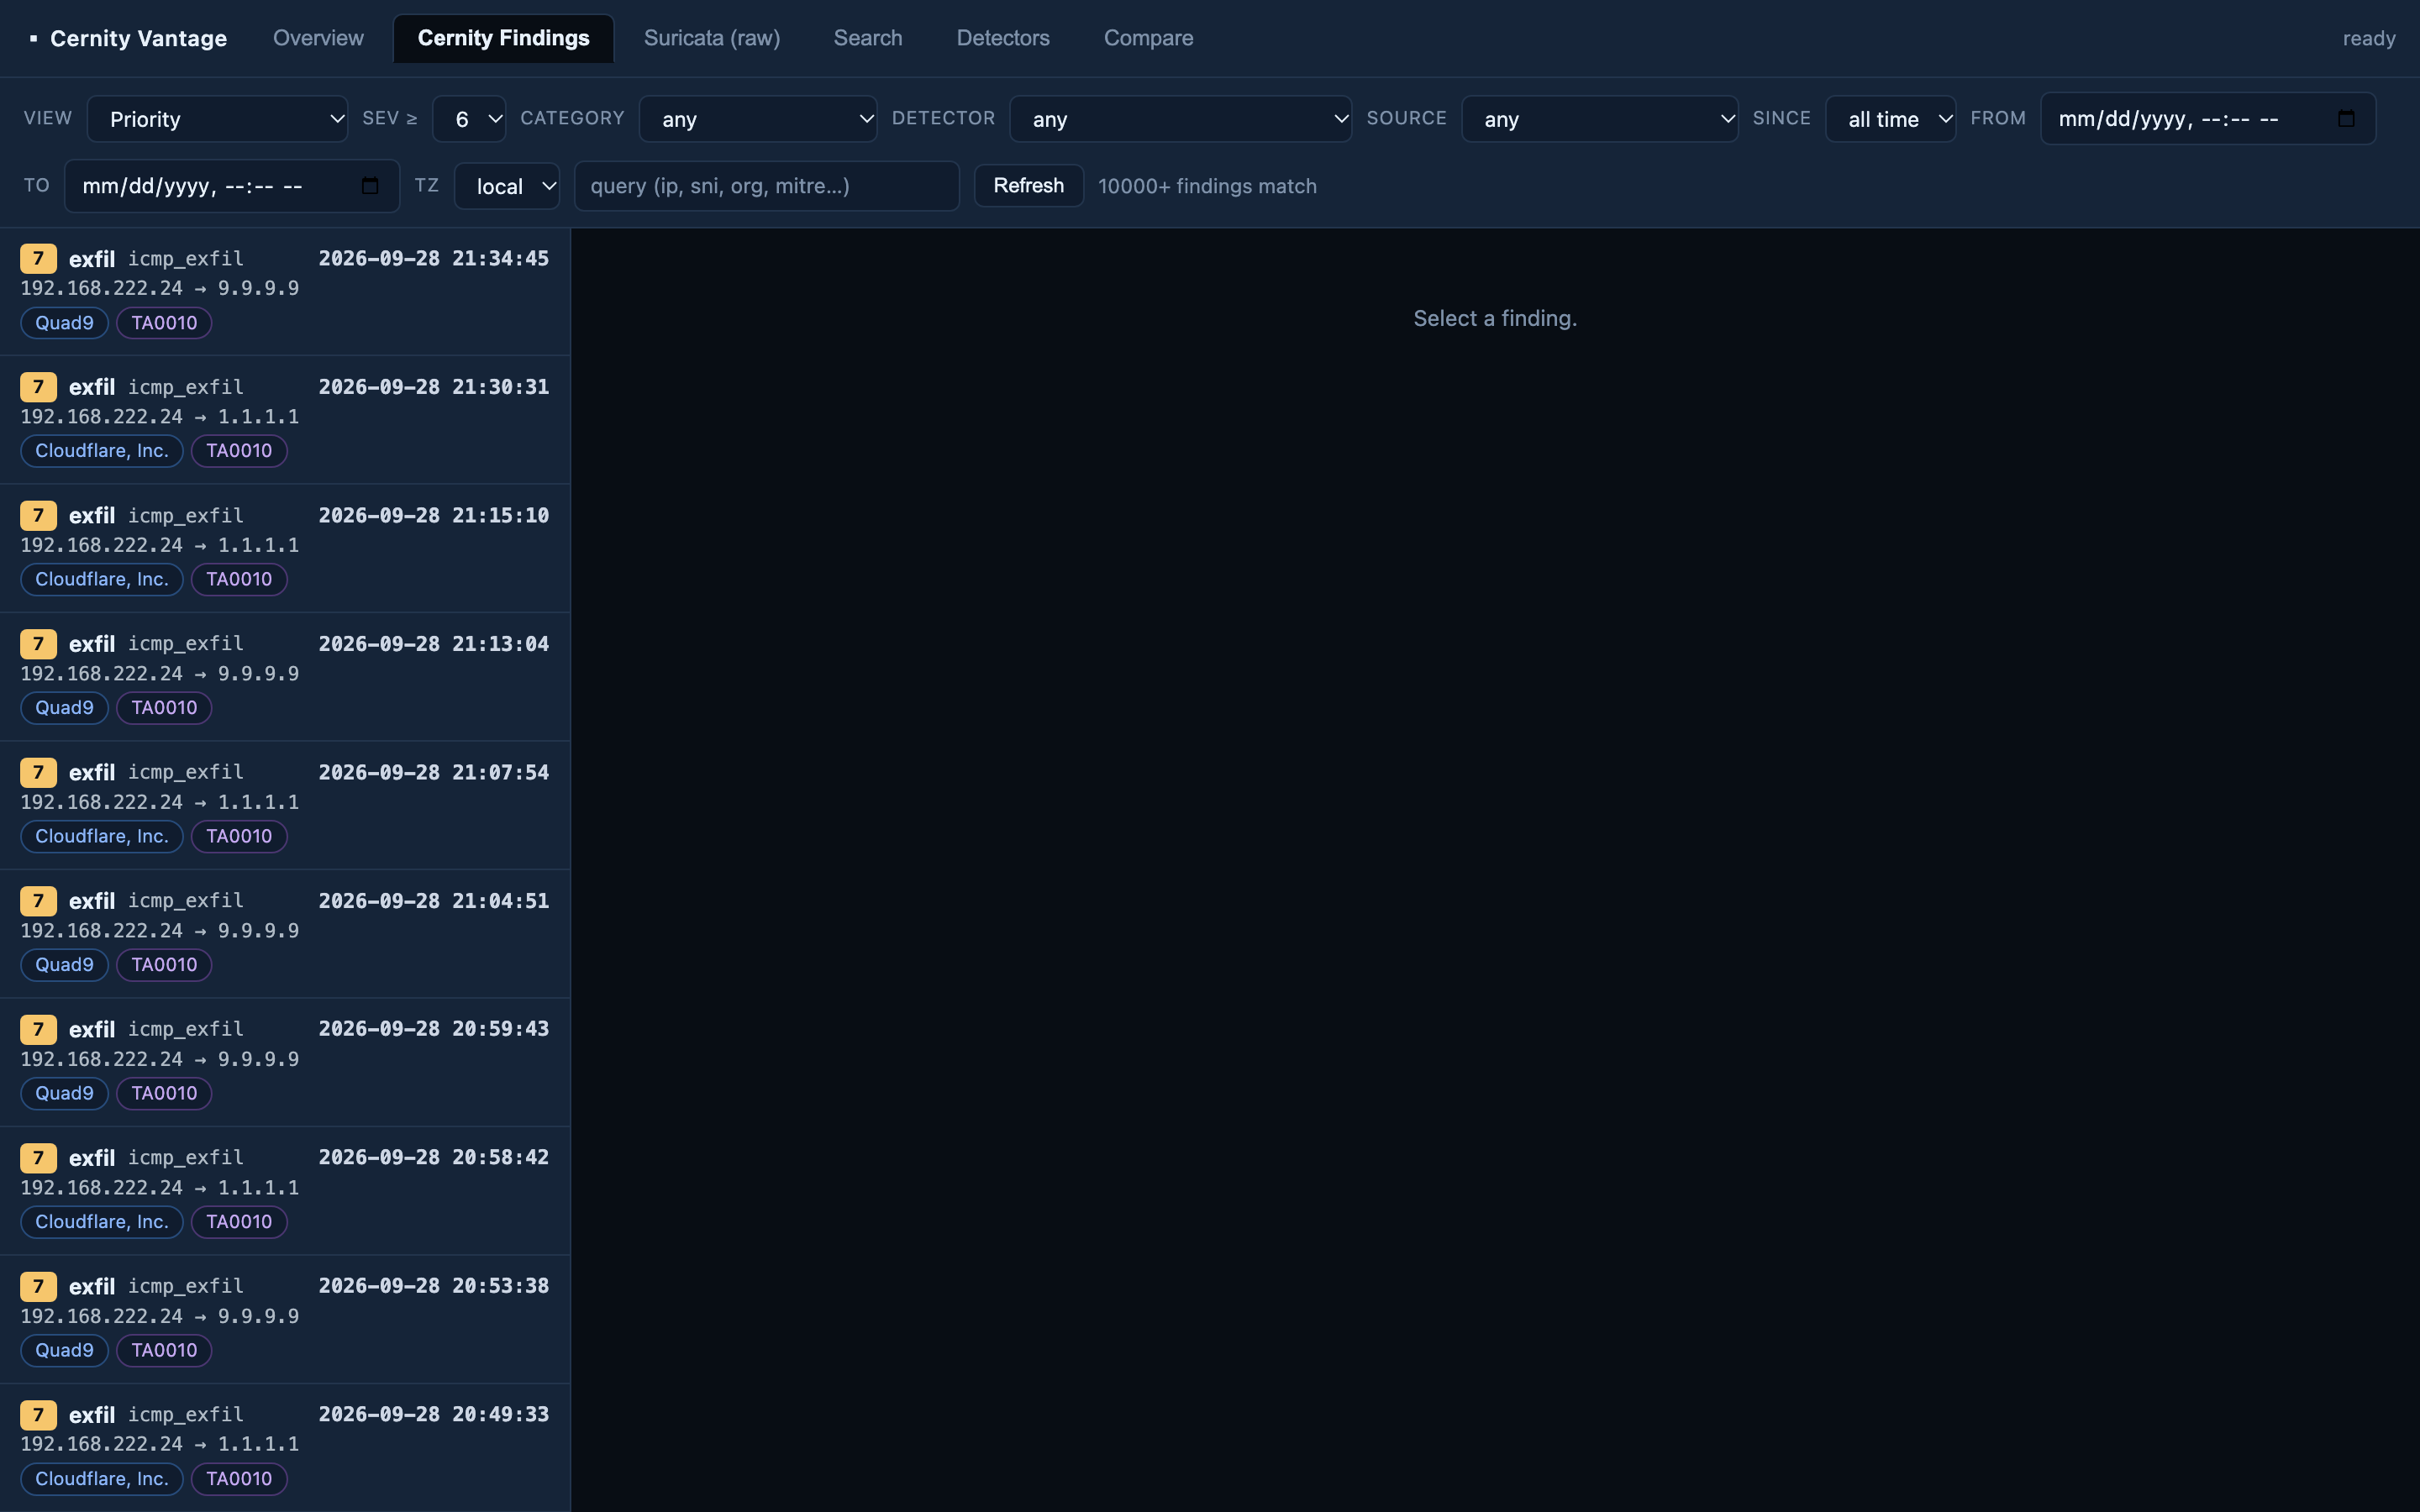
Investigation queue with triage tiers
Vantage is built around an investigation queue. Its five triage tiers — Threat, Lead, Low-signal, Observation, Allowlisted — are lead-ordering aids, not verdicts: they rank what to look at first so high-signal work stays at the top and noise stays out of the way. The “Threat” tier does not assert that something is a threat; the investigation, not the tier, establishes what happened. A benign allowlist keeps known-good behavior out of the active queue without deleting it (owner + justification
- expiry, always auditable).
Tiers rank on the detector’s own conviction, which is deliberately not the same thing as the confidence printed on the finding. When a sensor’s visibility was impaired, Cernity discounts a finding’s confidence (see behavioral baselines) — and a discount is a statement about the sensor, not about how convinced the detector was. So a strongly-supported lead from a half-blind sensor stays in Priority rather than sliding into Low-signal, and the tier reason names the sensor impairment and its reason codes instead of blaming detector confidence. A queue row from an impaired sensor is badged as such. An unmeasured sensor is not an impaired one: it changes nothing about the tier.
Finding detail, assessment, and the feedback loop
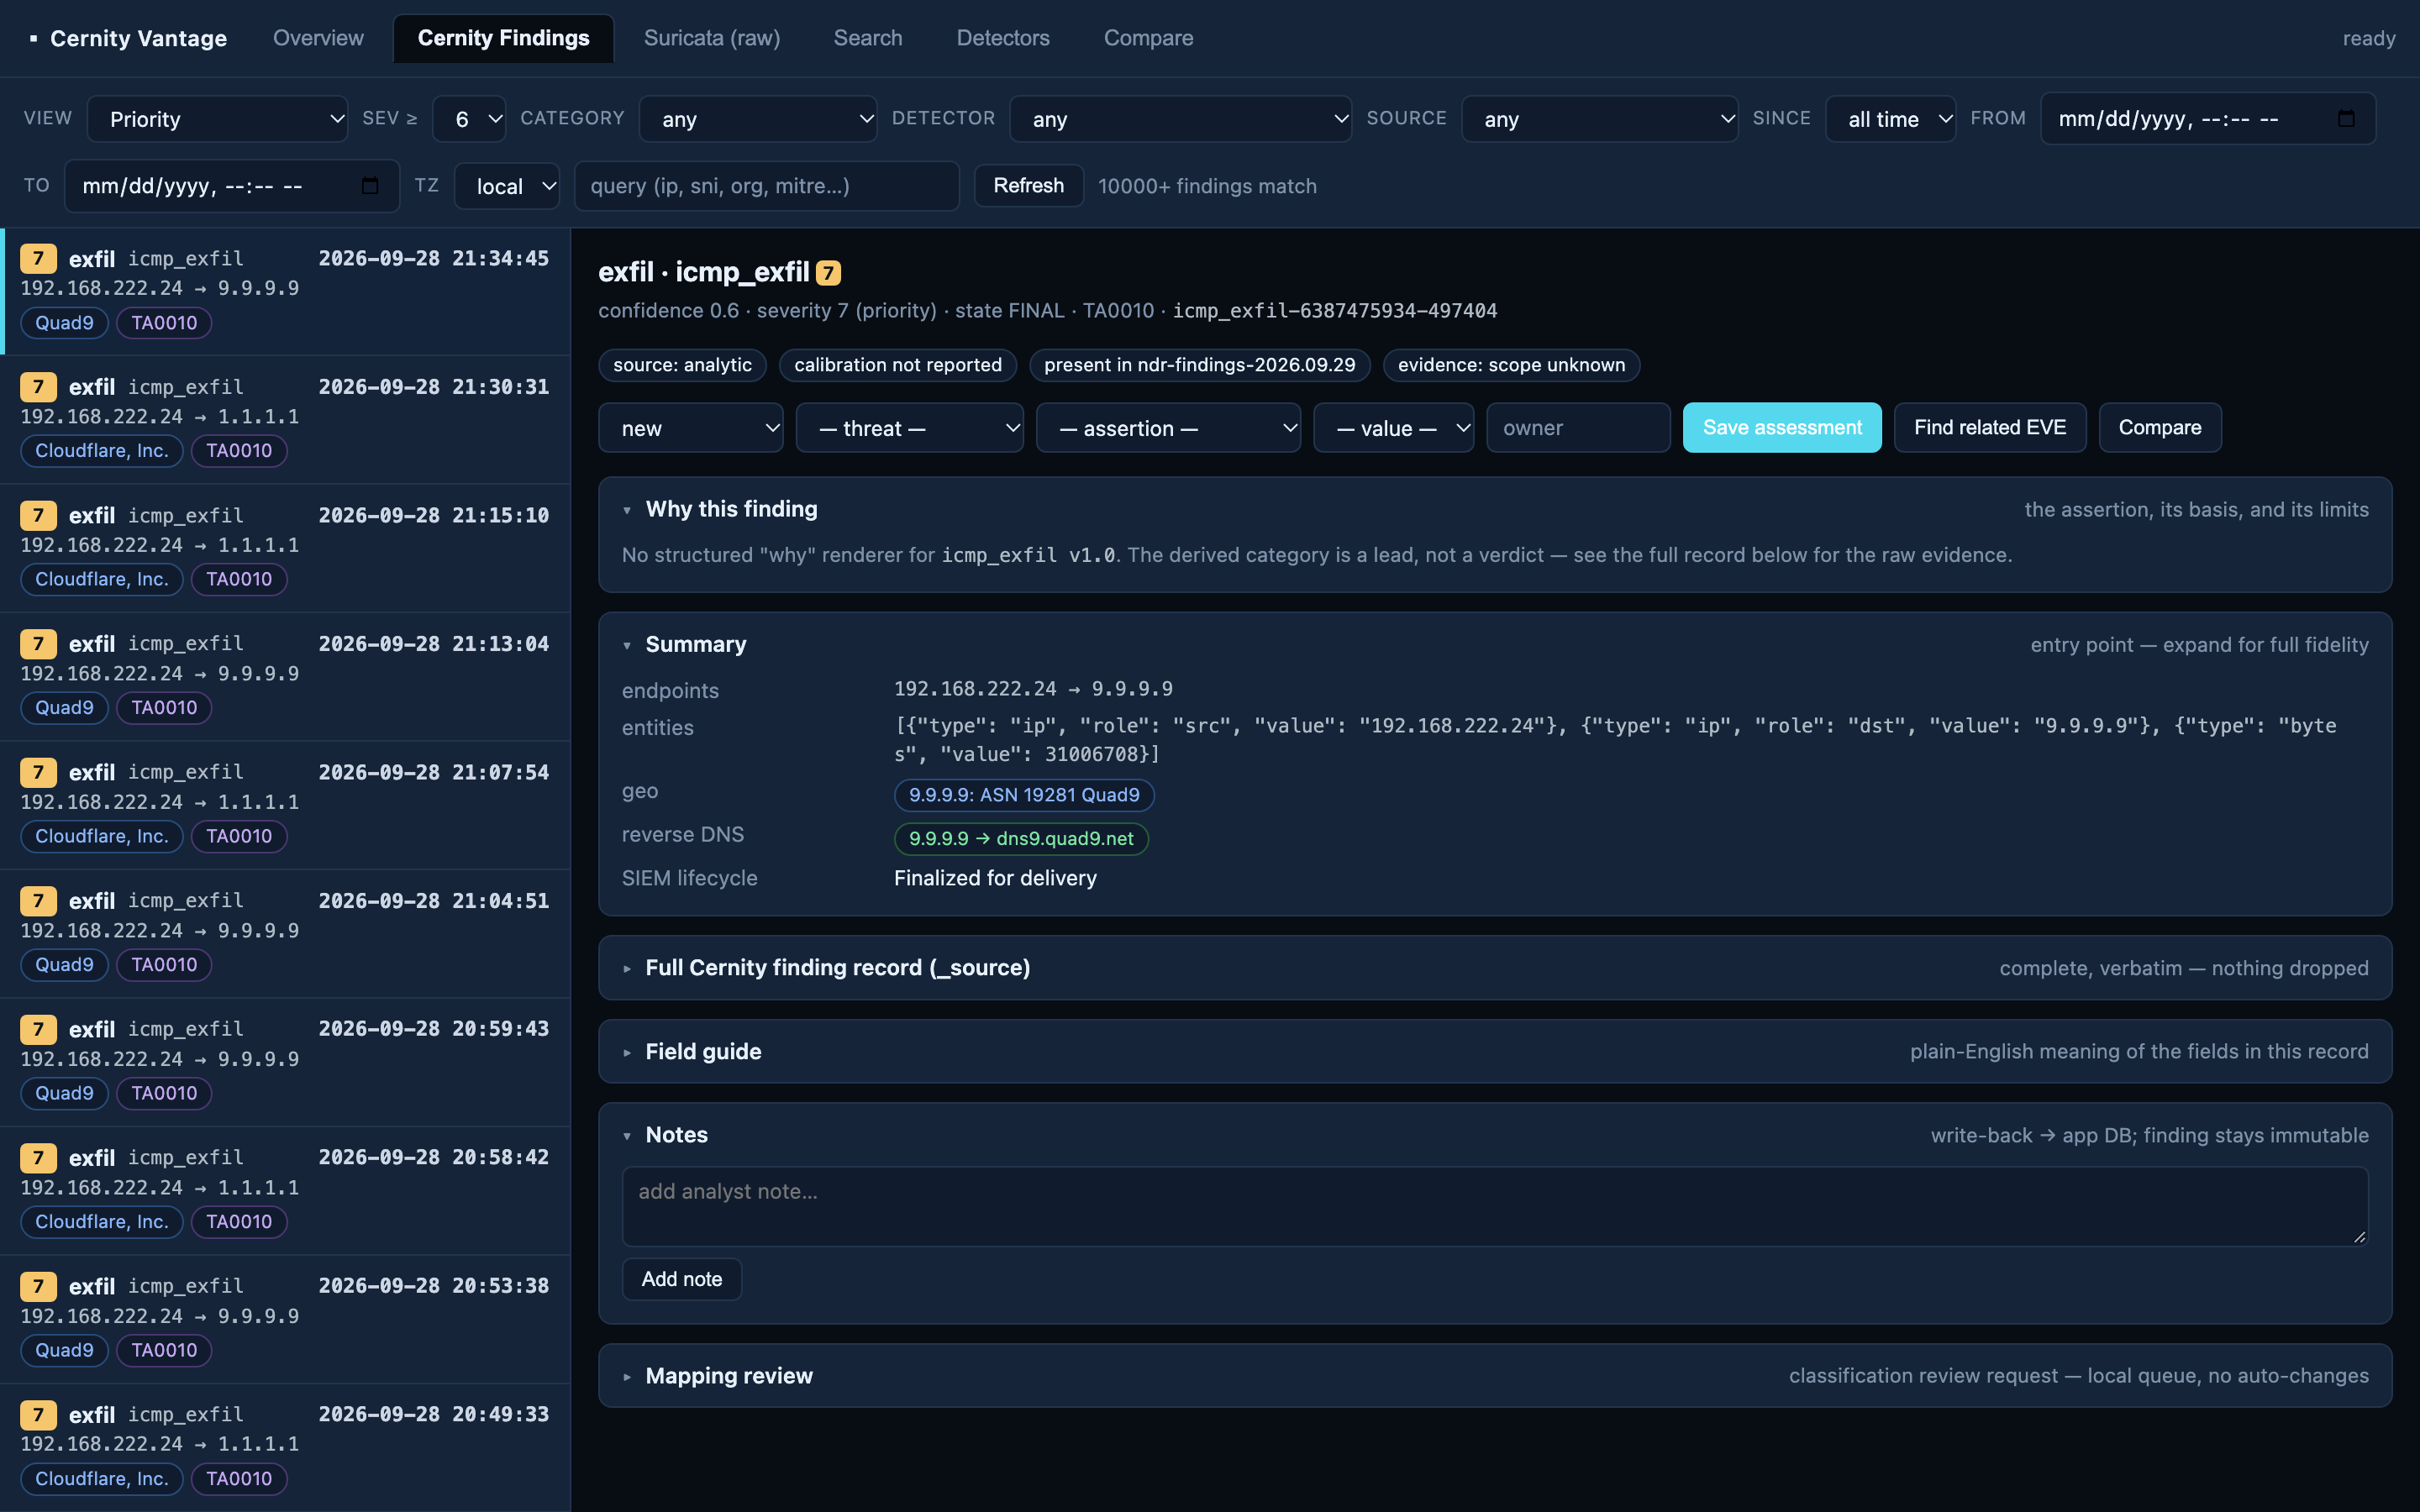
Selecting a finding opens its detail: confidence, severity, lifecycle state, ATT&CK mapping, endpoints, entities, and geo/reverse-DNS enrichment, plus an explanation of why the finding was derived (a lead, not a verdict). Where a detector produced structured evidence, the detail renders it as an explanation panel: the observation-quality verdict with both the original and discounted confidence; an incident’s risk-family breakdown showing which behavior families contributed and which were capped because several detectors described one behavior; a beacon’s method and recovered period; JA4 reason codes with what each one does and does not support; and, where a per-destination ceiling bound, a note that the byte or duration total is a floor rather than an exact total. Each panel is evidence for a lead, never a verdict.
Where a finding’s confidence was discounted for sensor visibility, the panel clicks through to the coverage findings for that sensor — the records that say what actually happened to its view, with the operator explanation each one carries. The click-through is offered only for a measured impairment with an attributable sensor: an unmeasured or healthy sensor has no explanation to open, and offering one would imply otherwise. If the lookup finds nothing, it says so plainly — the explanation may sit outside the window or have aged out of retention — and it never reports that as the sensor having been fine. A failed lookup, or one whose scan could not reach the end of the window, is reported as such rather than as an empty result, because an absence claim is only as good as the scan behind it. Analyst assessments and allowlist decisions feed a tuning loop — dispositions flow to the feedback service as anomaly ground-truth, false-positive suppression, and ignore-list input (owner + justification + expiry + audit; suggestions only, never silent changes). A “find related EVE” action pivots from a finding into the raw evidence behind it.
Overview health & telemetry dashboard
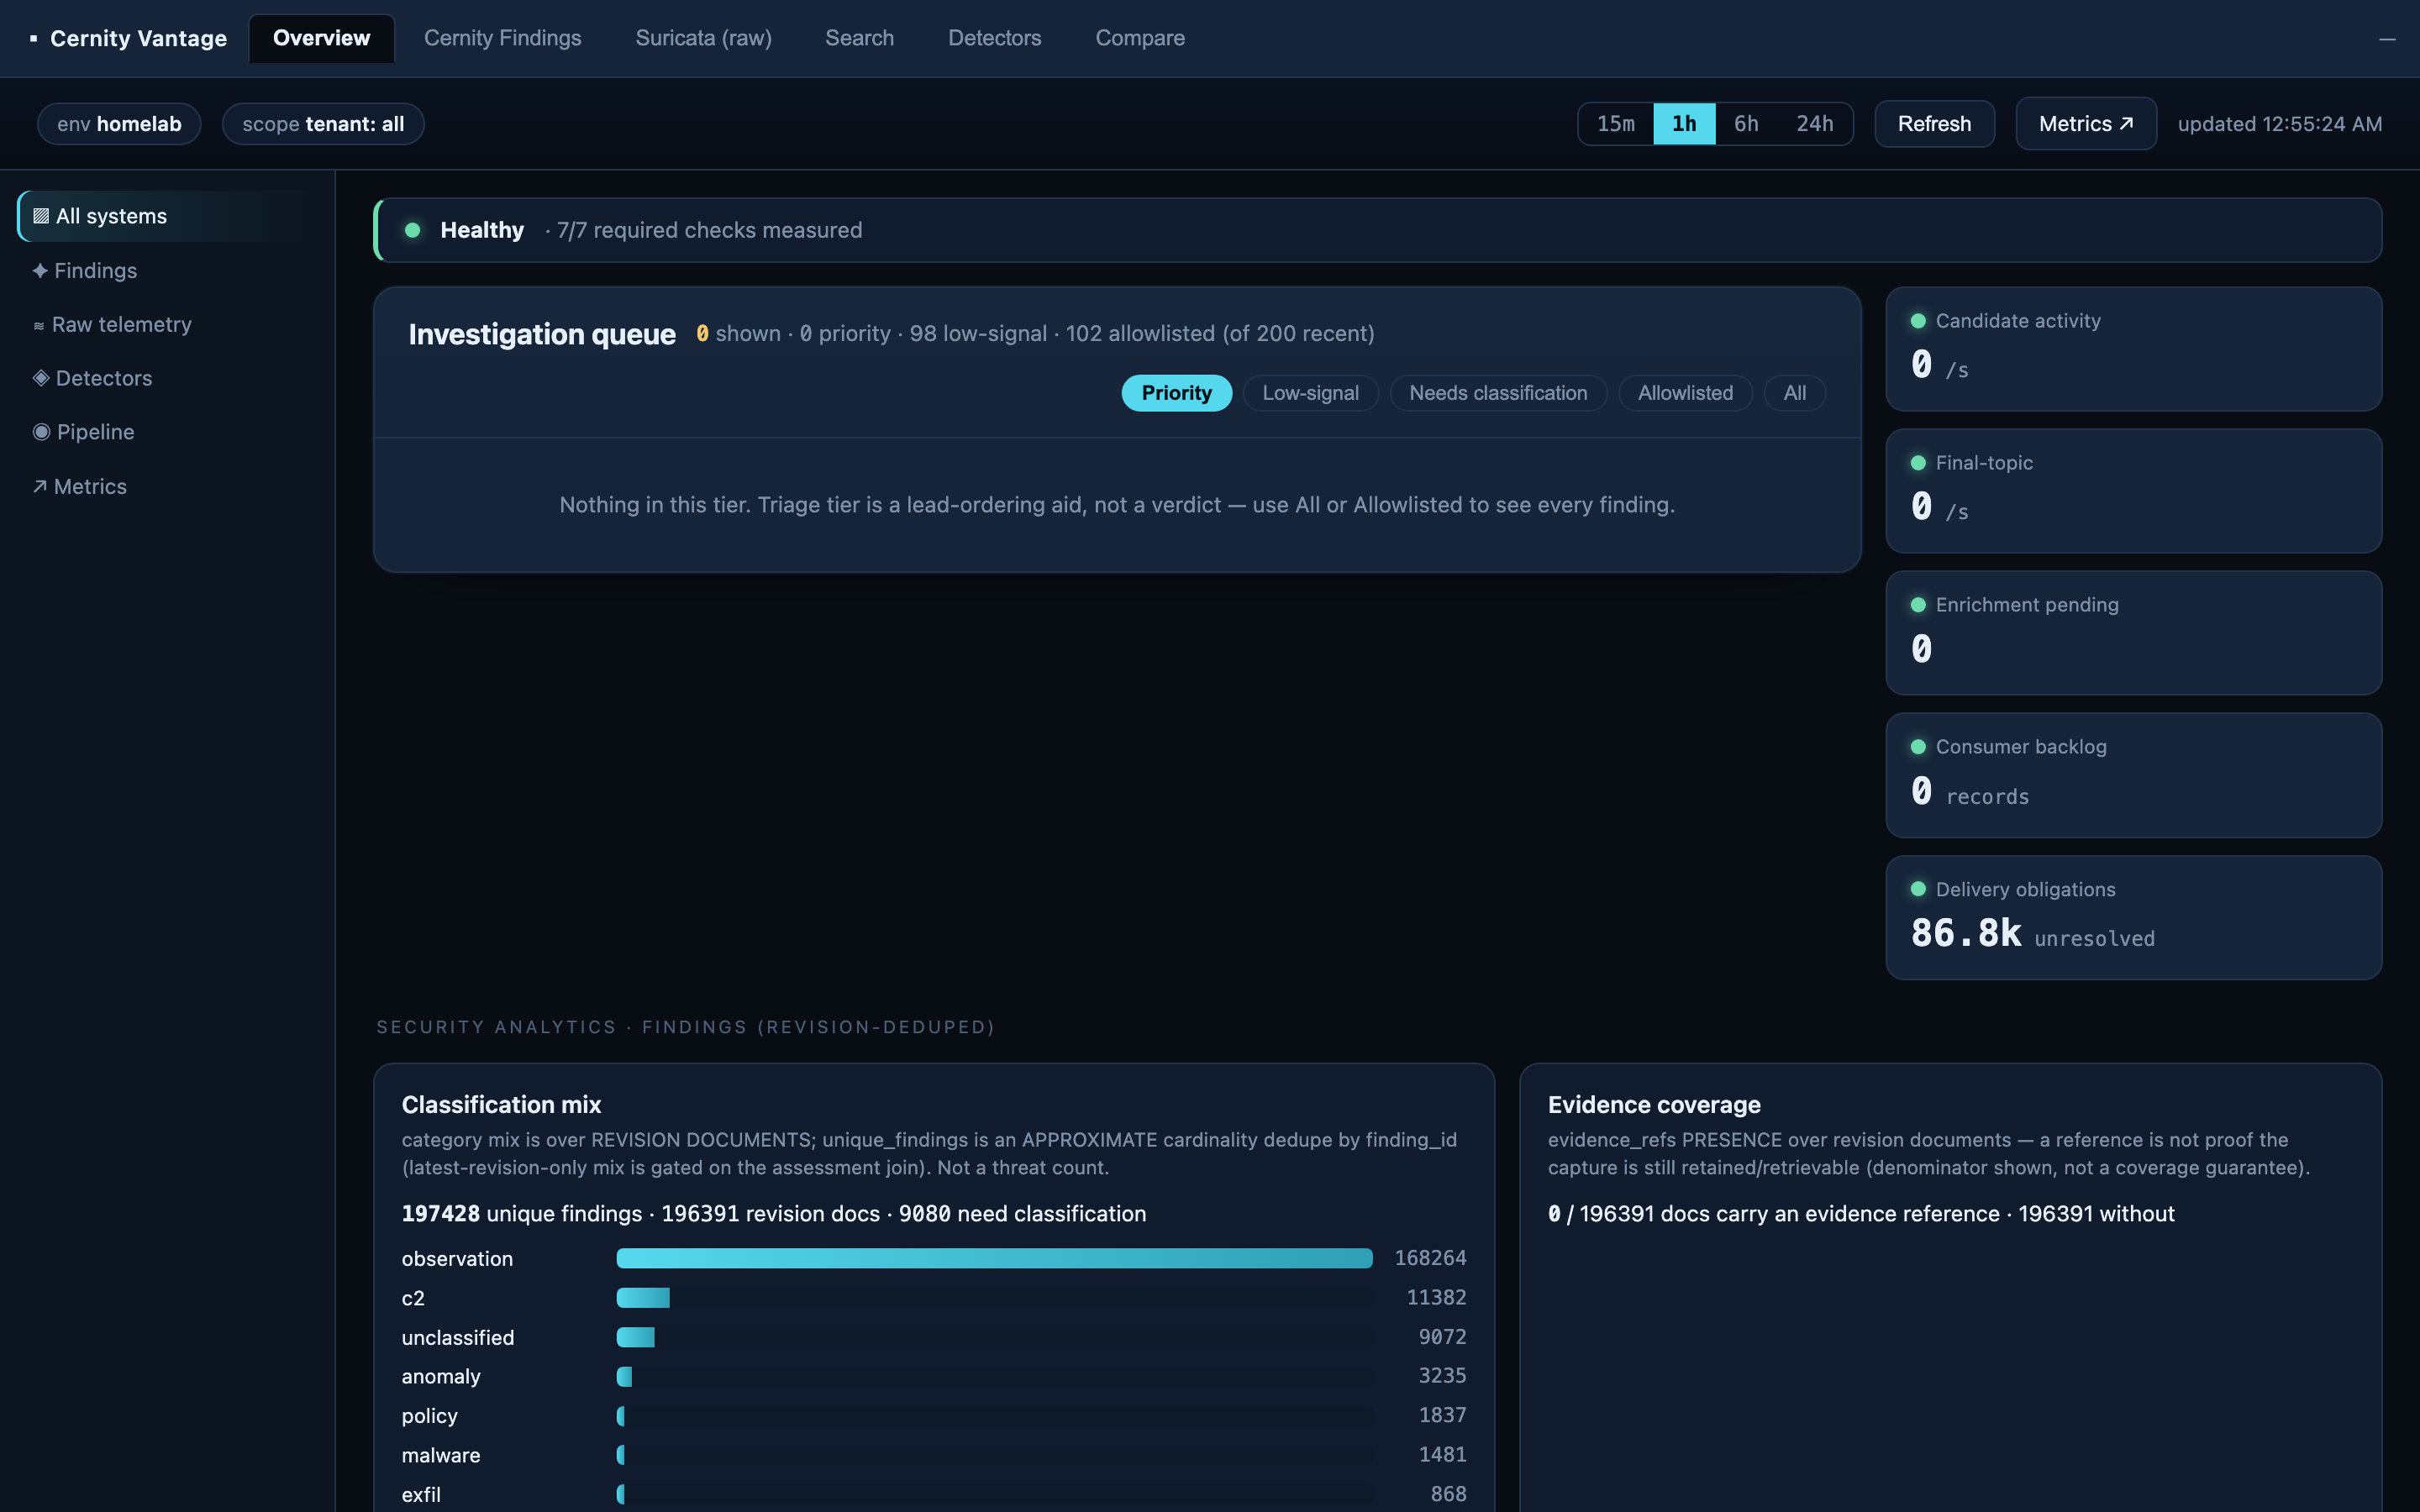
The landing Overview is a health/telemetry dashboard: ingest rates, finding volume, pipeline state, service up/down, and traffic across the deployment. It is store-agnostic — the metrics adapter reads from either Prometheus or InfluxDB (selected by config), and cards render an honest “unknown”/“not-applicable” rather than a fabricated number when a source isn’t wired.
Fleet-health and evidence pivots
- Fleet-health view — sensor registry status, heartbeats, and clock-skew flags from the fleet API.
- Evidence-pivot view — pivot a finding to its normalized
observation.v1records by entity, time, and type, and jump to preserved packets where available.
Coverage, detection quality, and cases
- ATT&CK coverage + detection-quality views — mapped technique coverage and per-detector production quality (precision/false-positive signal) derived from the analyst-disposition feedback loop.
- Case management — a multi-analyst case model (ownership, assignment, notes, state) linking findings and entities, read through the case API.
Configuration reference
All settings are environment variables (see .env.example). The essentials:
| Variable | Purpose |
|---|---|
ES_URL, ES_INDEX, ES_USER, ES_PASS | Elasticsearch/OpenSearch findings source |
REDPANDA_BOOTSTRAP | Kafka/Redpanda bus (consumer-lag + throughput metrics) |
METRICS_BACKEND (prometheus|influx), METRICS_URL, METRICS_TOKEN, METRICS_DB | Overview dashboard metrics adapter |
FLEET_API_URL / _TOKEN | Fleet-health view |
EVIDENCE_API_URL / _TOKEN | Evidence-pivot view |
COVERAGE_API_URL / _TOKEN, QUALITY_API_URL / _TOKEN | Coverage & detection-quality views |
CASE_API_URL / _TOKEN | Case management |
SOC_DB | Local SQLite for triage/allowlist state (mount /data as a volume) |
Tokens are used server-side only; the browser never receives them. See metrics setup in the repository for the Overview dashboard backends and the metrics adapter contract.